325Trades
54%Win rate
+1.21%Avg per trade
1.65Profit factor
+£1,967Profit, £500 a trade
−£317Max drawdown
Company insiders in America must report their trades in their own firm’s shares to the Securities and Exchange Commission, on a filing known as Form 4, within two business days. Most of these filings say little: executives sell to diversify, pay tax or buy a house. Purchases are rarer and more telling, because there is only one obvious reason to buy. The question tested here is narrower: when several insiders buy on the same day, with real money, does the share price keep rising afterwards?
Over nearly five years of filings, it did, modestly and after costs. A cluster of insider purchases, bought at the next open and sold three days later, made an average of 1.2% a trade.
Each trade is £500, with Interactive Brokers’ tiered commissions and a modelled bid-ask spread deducted.
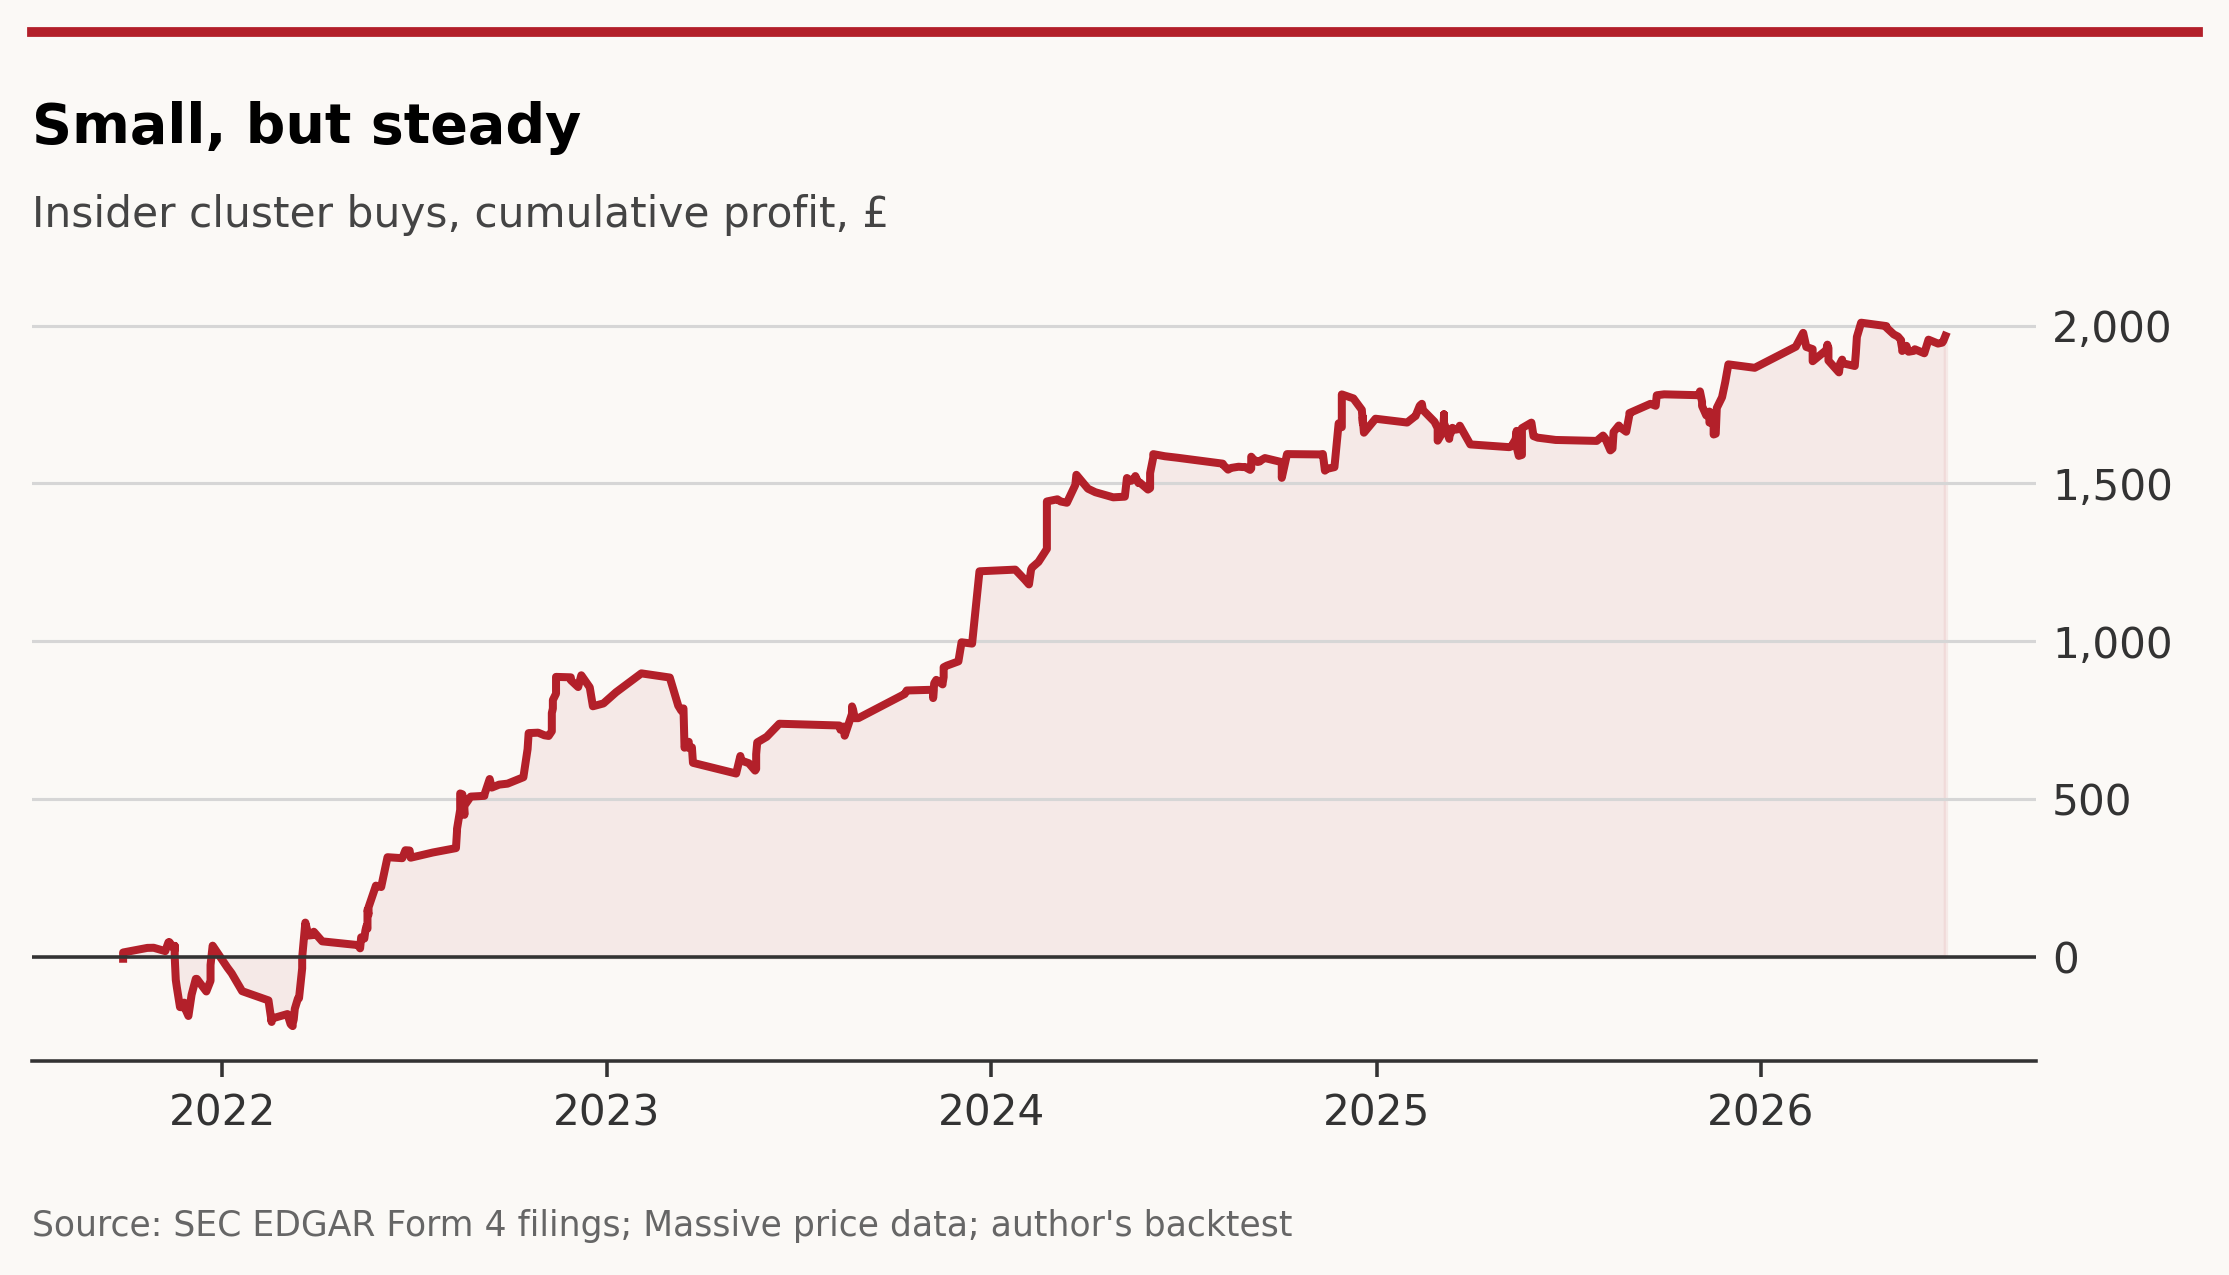
The equity curve is not smooth, and nor should it be. Most trades are small; the profit comes from a steady excess of modest winners over modest losers, plus the occasional large jump. Stripping out the best 1% of trades still leaves a profit of about £1,450.
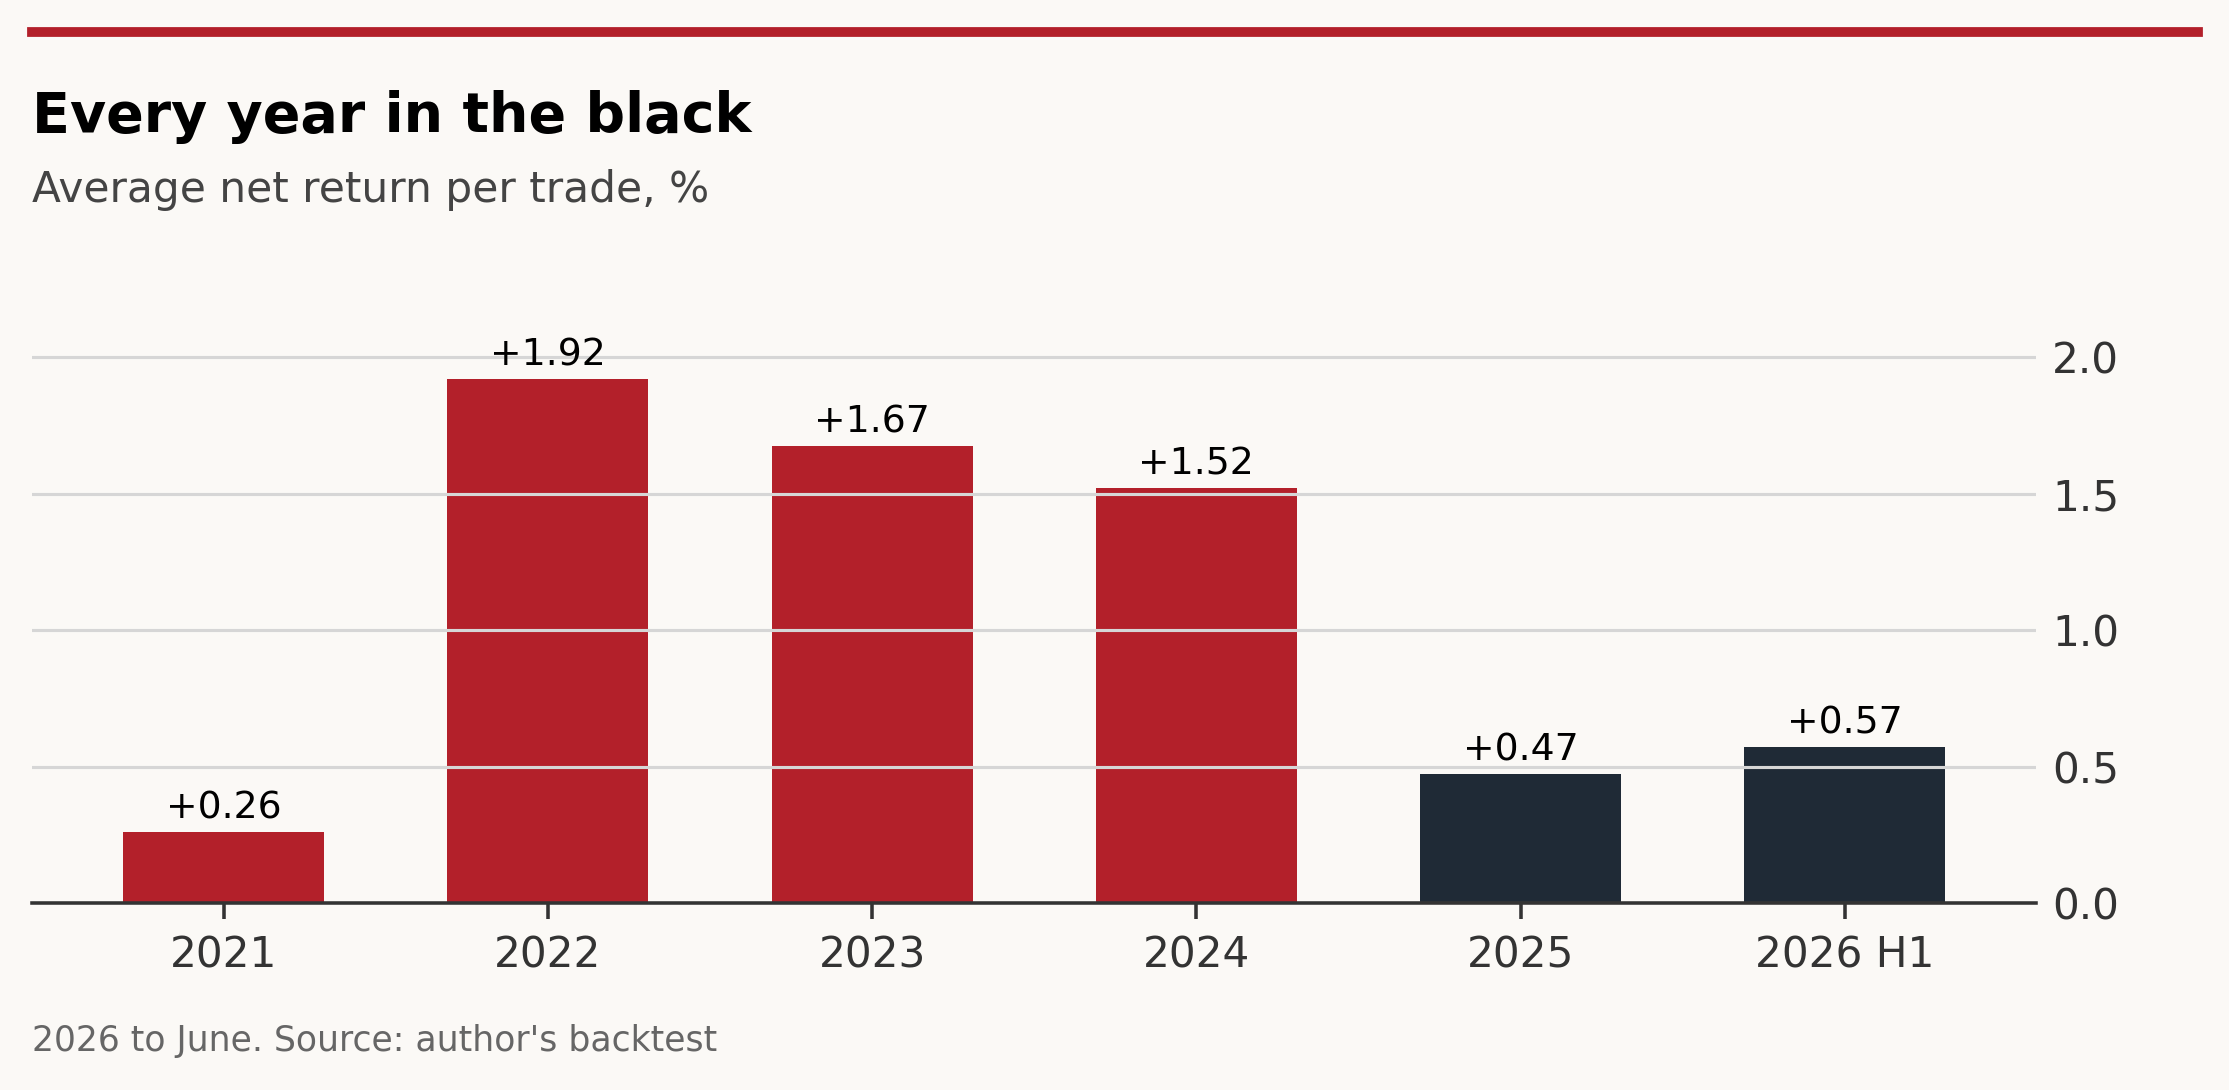
| Year | Trades | Avg return | Win rate | P/L |
|---|---|---|---|---|
| 2021 | 27 | +0.26% | 52% | £35 |
| 2022 | 80 | +1.92% | 61% | £768 |
| 2023 | 50 | +1.67% | 54% | £419 |
| 2024 | 64 | +1.52% | 53% | £484 |
| 2025 | 68 | +0.47% | 53% | £161 |
| 2026 H1 | 36 | +0.57% | 44% | £101 |
The strategy made money in all six years, but the edge has thinned. Trades before 2025 averaged 1.55%; since then, 0.51%. That may be noise in a smaller sample, or it may be the signal being arbitraged away as insider-tracking tools multiply. The honest answer is not yet known.
At least 16 variants were tested on the same data, which is itself a warning (see below). The ones that failed are as instructive as the one that worked:
Three matter most. First, the bid-ask spread is modelled (15, 8 or 5 basis points a side, depending on company size), not measured from real quotes. Second, testing many variants on one dataset inflates the chance of finding something by luck; the real test is data the model has never seen, which arrives with the SEC’s filings for the third quarter of 2026. Third, trade size matters: at £100 a trade, Interactive Brokers’ minimum commission eats most of the edge. The strategy needs at least £250 a position, and works best at £500.
It is therefore promising, not proven. It will be paper-traded before any real money goes near it.
Hypothetical backtest, September 2021 to June 2026. Not investment advice. Past performance is not a reliable guide to future results. See the disclaimer.